
Tax Revenue Timeline

Understanding the funding gap

One Goal: Keeping Services Aligned With Growth

Whether your community relies on property tax or sales tax funding, understanding the timing gap is essential to planning the services your new residents will need from day one.

Different Funding Tools for the Same Growth Challenge.

Property Tax Funding
Why Communities Must Plan Ahead of Growth
NEW
DEV
Year 1: Development Announced
🏗️
Year 2: Homes Under Construction
🏠
Year 3: Residents Move In
🏡
Year 4: Full Property Tax Value Realized
Sales Tax Funding
Funding That Keeps Pace With Growth
NEW
DEV
Year 1: Development Announced
🏗️
Year 2: Homes Under Construction
🏠
Year 3: Residents Move In
💰
Year 4: Full Property Tax Value Realized

The Impact of Funding Timelines

Why the current model creates a critical gap

Traditional emergency service funding in Texas relies heavily on property taxes — a model designed for slower-growth eras. In a rapidly expanding district, this creates a structural funding lag that directly impacts operational readiness.

💰
Revenue vs. Demand
Property tax revenue is based on historical valuations, meaning there is often a multi-year gap between when a new home is built and when the district receives the funds to provide services for it.
🏗️
Construction Lag
New developments are assessed after construction is complete, creating a 12–24 month delay before tax revenue reflects actual growth in the district.
🚒
Operational Readiness
Without adequate funding, the department cannot pre-position the stations, apparatus, and personnel needed to maintain safe response times as the district grows.
⏱️
Response Time Risk
Every minute added to an emergency response time has measurable consequences. Underfunding puts lives and property at greater risk across the expanding service area.
📊 Who Bears the Burden? — Current vs. Proposed
Current Funding Model
Today's
Split
Property Tax 57%
Sales Tax 43%
Proposed Funding Model
Proposed
Split
Property Tax 43%
Sales Tax 57%

Today, 57% of the funding burden falls on property owners. The proposed sales tax increase would flip this balance — shifting the majority to sales tax so that everyone who shops and does business in the district contributes to emergency services, not just property owners.

Where the 1% Applies

Not every area is the same — here's what changes and what doesn't

1% Proposed Increase
7.25% Current Rate (affected areas)
8.25% Proposed Rate (Texas max)
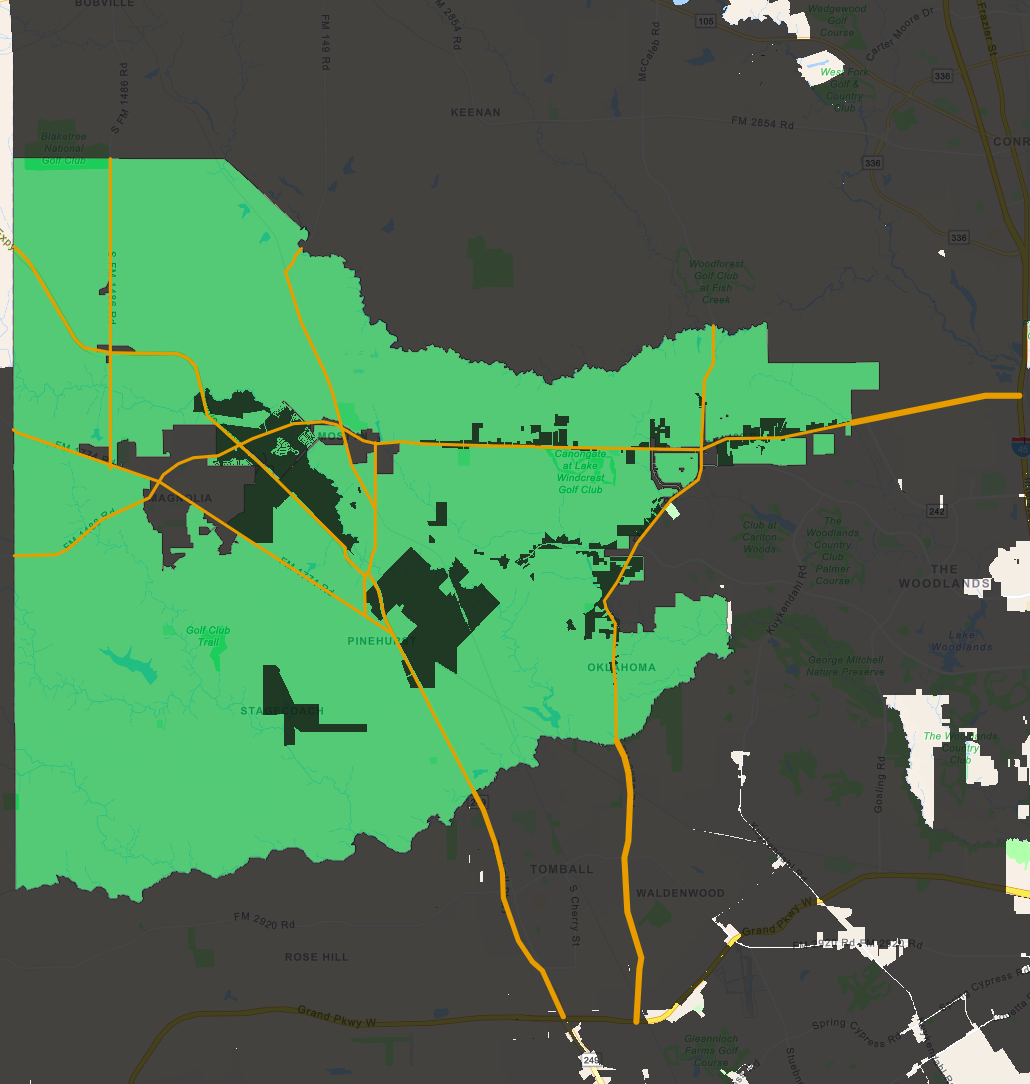
1-cent sales tax district map
🔍 Click map to enlarge  |  Sales tax district coverage map
🟩 Green Areas — Affected
Currently at 7.25% sales tax. The proposed 1% increase would bring these areas to the Texas maximum of 8.25%. This is where the new sales tax revenue would be collected.
⬛ Black Areas — No Change
Already at the 8.25% maximum allowed under Texas law. These areas would see no change to their sales tax rate if the measure passes.
💡 How the Funding Model Changes
🌐
Broader Revenue Base
Captures revenue from commuters, visitors, and commercial activity — not solely property owners.
🏠
Less Burden on Property Owners
Shifts funding away from being primarily property-tax driven, reducing the load on homeowners.
📈
Growth-Aligned Funding
Revenue scales naturally with commercial development and community activity as Magnolia grows.

Tax Impact Calculator

See What the Difference Looks Like

Enter a purchase price below to see the difference between the current 7.25% sales tax rate and the proposed 8.25% rate.

$
Try $50 for groceries, $500 for appliances, $25,000 for a vehicle
Enter a purchase amount above to see the comparison.